
Greetings, I’m Papazon (@nomadkazoku).
Embarking on a new adventure in April 2023, my family relocated from Japan to Malaysia, and we now call Kuala Lumpur our home.
In this blog, I will share some exciting stories that led me to open a securities account with [affi id=3] to move abroad. Surprisingly, I discovered that the account is free to use and maintain even for non-US residents (with some conditions).
Check out our related posts on [ Firstrade ] for more in-depth information:
Firstrade – [ Commission-Free U.S. Stock Trading for Non-Residents! ]
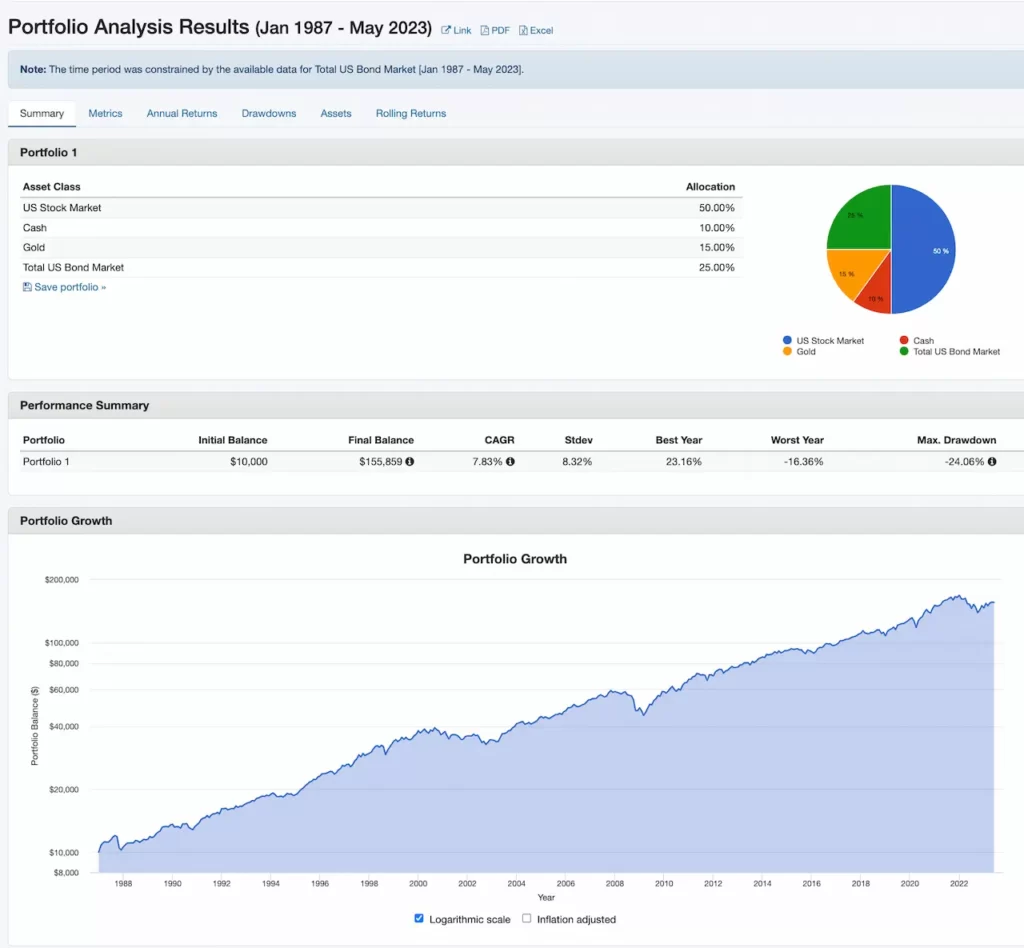
With regard to the investment portfolio, as we discussed in the previous article, we have roughly determined the ratio of each asset and then used Portfolio Visualizer to narrow down the specific ETFs.
In this article, we will explain the basic operations of how to use Portfolio Visualizer to help you decide which products to invest in.
Certainly! Here’s a draft of the article following the provided guidelines:
What is Portfolio Visualizer?

In the realm of investing, Portfolio Visualizer stands as a robust online software designed to aid investors in navigating the complexities of portfolio management. It offers a range of analytics tools that empower investors to analyze their portfolios, examine potential asset allocations, and perform backtesting simulations.
Importance of Portfolio Visualization
In the dynamic world of investing, understanding your portfolio is just as crucial as building it.
Having a deep comprehension of how your investments interact with each other and how they respond to market conditions can make the difference between success and failure. In order to understand this, it is important to use portfolio visualization as a tool.
Introduction to Portfolio Visualizer
One tool that can greatly aid investors in their journey is Portfolio Visualizer.
This online platform has reshaped how investors analyze their portfolios, providing detailed insights that were once difficult to obtain.
Definition and Function
Portfolio Visualizer is a powerful online tool that provides a variety of analysis options for investors.
It’s designed to offer in-depth insights into investment portfolios, allowing users to see their assets in a clear, visual manner. The primary purpose of this tool is to aid in the decision-making process, helping investors make more informed choices about their assets.
History and Development
The origins of Portfolio Visualizer trace back to its inception in the early 2010s.
Over the years, it has evolved and grown, continually adding new features and tools to assist investors in managing their portfolios effectively.
Key Features of Portfolio Visualizer
Portfolio Analysis
Arguably the most significant feature of Portfolio Visualizer is its ability to provide comprehensive portfolio analysis.
Backtesting
Backtesting allows users to test how a certain investment strategy would have performed historically. This is a valuable feature as it gives investors a chance to understand the potential success or failure of their strategy without risking real money.
Asset Correlations
The tool also allows for the study of asset correlations, an essential aspect of diversification. By understanding how different assets interact with each other, investors can build a portfolio that is resilient to market fluctuations.
Investment Planning
Portfolio Visualizer doesn’t stop at analysis—it also provides valuable tools for future investment planning.
Monte Carlo Simulation
The Monte Carlo Simulation tool allows investors to assess the potential outcomes of their investment strategies under different scenarios. This tool uses random sampling to simulate a range of possible outcomes, giving investors a sense of the risk and return potential of their strategies.
Asset Allocation
With the Asset Allocation tool, investors can design their optimal portfolio structure. By examining different combinations of assets, this tool helps investors create a balanced portfolio that aligns with their risk tolerance and investment goals.
How to Use Portfolio Visualizer
Creating an Account
The initial step to begin using Portfolio Visualizer is to create an account.
This process is straightforward and only requires a few pieces of personal information.
Inputting Portfolio Information
Once an account is set up, the next step is to input the details of your portfolio.
This involves entering information about your current holdings, including the types of assets, their quantities, and their current values.
Navigating the Platform
With your portfolio inputted, the vast array of tools and features in Portfolio Visualizer is at your disposal.
Running a Backtest
Running a backtest on Portfolio Visualizer is straightforward and can provide valuable insights.
Simply select the backtesting feature, input your investment strategy, and let the platform do the rest.
Using the Monte Carlo Simulation
To use the Monte Carlo Simulation tool, follow these simple steps.
Navigate to the tool, input your portfolio details and assumptions, and run the simulation.
Setting up Asset Allocation
Setting up your asset allocation is a key step in building your investment strategy.
On Portfolio Visualizer, you can specify your desired allocations, and the platform will visualize your portfolio structure accordingly.
Optimizing your Portfolio with Portfolio Visualizer
Setting Targets and Constraints
The real magic of Portfolio Visualizer comes alive when you start to customize it according to your specific financial goals and risk tolerance. By adjusting targets and constraints, you can develop a portfolio that aligns with your investment vision.
Reading and Interpreting Results
The extensive data generated by Portfolio Visualizer can initially seem overwhelming, but with a little guidance, it transforms into a roadmap to better investing decisions. Understanding these results is key to optimizing your investment strategy.
Limitations and Considerations
While Portfolio Visualizer is a powerful ally in investment management, it’s crucial to understand its limitations and employ it as part of a broader financial strategy.
It’s important to remember that past performance is not always indicative of future results, and all investment decisions should consider multiple data points and sources.
Wrapping it Up: The Power of Portfolio Visualizer
Portfolio Visualizer, with its wealth of features and user-friendly design, can significantly aid investors, providing an extensive toolkit for understanding, optimizing, and tracking investment portfolios.
While it doesn’t replace the advice of a financial advisor, it serves as an effective supplement to make more informed investment decisions.
FAQs
Despite the comprehensive nature of this guide, you may still have some questions about Portfolio Visualizer, so let’s address some of the most common queries:
Q: Is Portfolio Visualizer free?
A: Portfolio Visualizer does offer a basic free plan, but to access more advanced features, you might want to consider one of their paid subscriptions.
Q: Can I link my brokerage account to Portfolio Visualizer?
A: Portfolio Visualizer doesn’t support linking brokerage accounts. Please check their website for the most current information.
Q: Is Portfolio Visualizer only useful for individual investors?
A: Absolutely not. Portfolio Visualizer is a useful tool for both individual investors and financial professionals. It provides valuable analysis that can assist in making well-informed investment decisions.